Results and Discussion
A total of 178 registrations have been completed as of November 14, 2018. This represents the efforts of 58 faculty, and includes a total of 108 different courses. These numbers are down from last semester as shown by Figure 1.
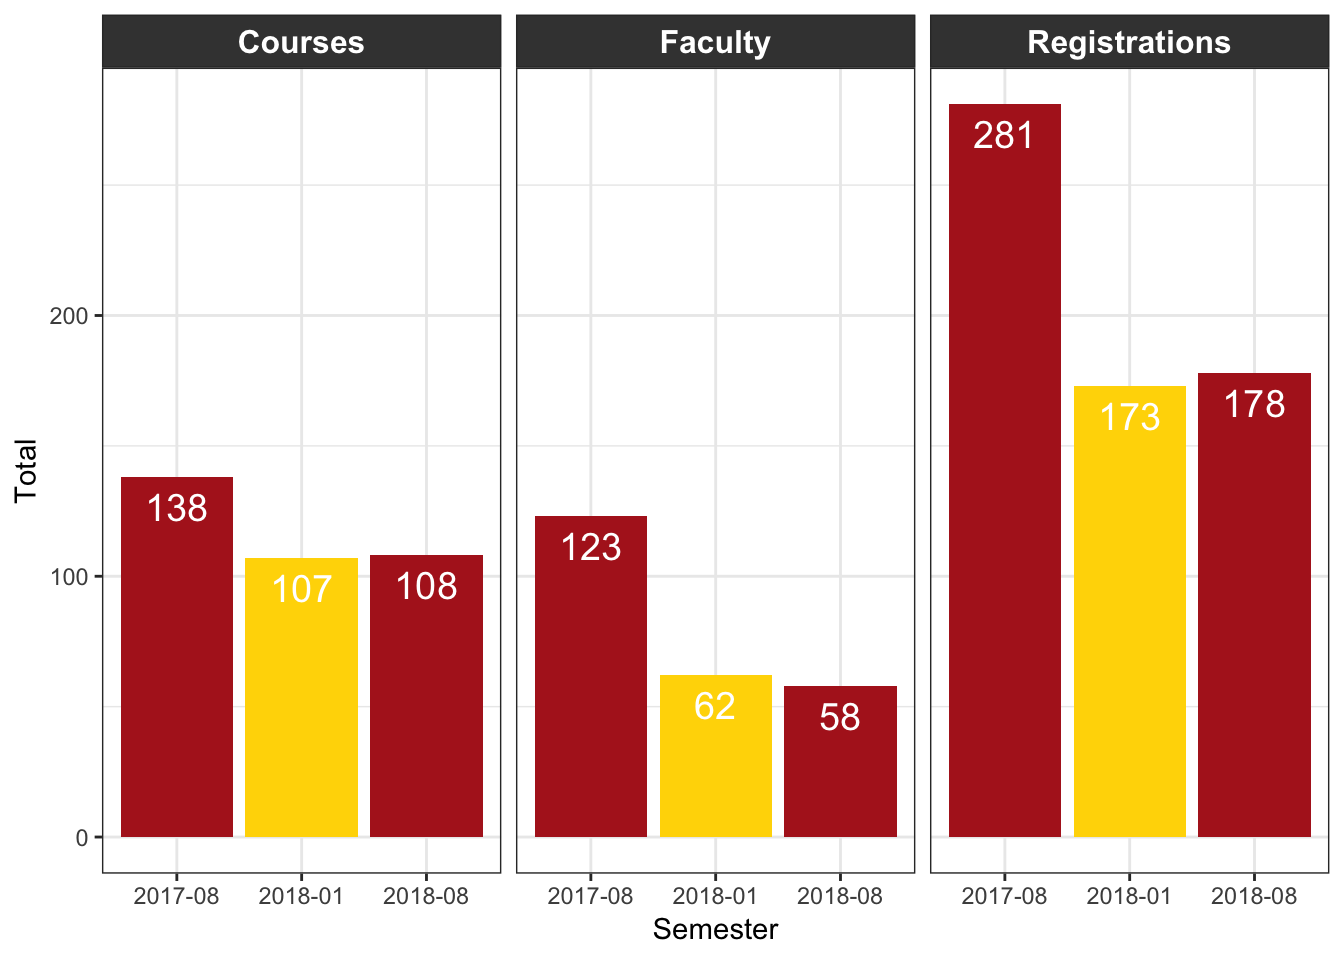
Figure 1: Comparison of registrations between Fall 2017 and Spring 2018.
As compared to Fall 2017, the total number of registrations was down by 36.7%. Moreover, the number of faculty members registering to report assessment was strongly down (by 52.8%). This primarily reflects the fact the the Ferris Non-Tenured Faculty Organization members have elected to not participate in assessment. Since those members registered but did not report data last semester, the actual amound of data that we collect this semester may still be similar to that of last semester. Finally, the number of courses reporting is also down this semester (by 21.7%). It seems that for now, the number of courses being registered has leveled off.
Are you concerned by the decrease in registrations this semester? What factors do you think are contributing to this trend? What suggestions do you have to address the decrease in registrations?
The distribution of the registrations between the eight core competencies for the spring semester is shown in Figure 2.
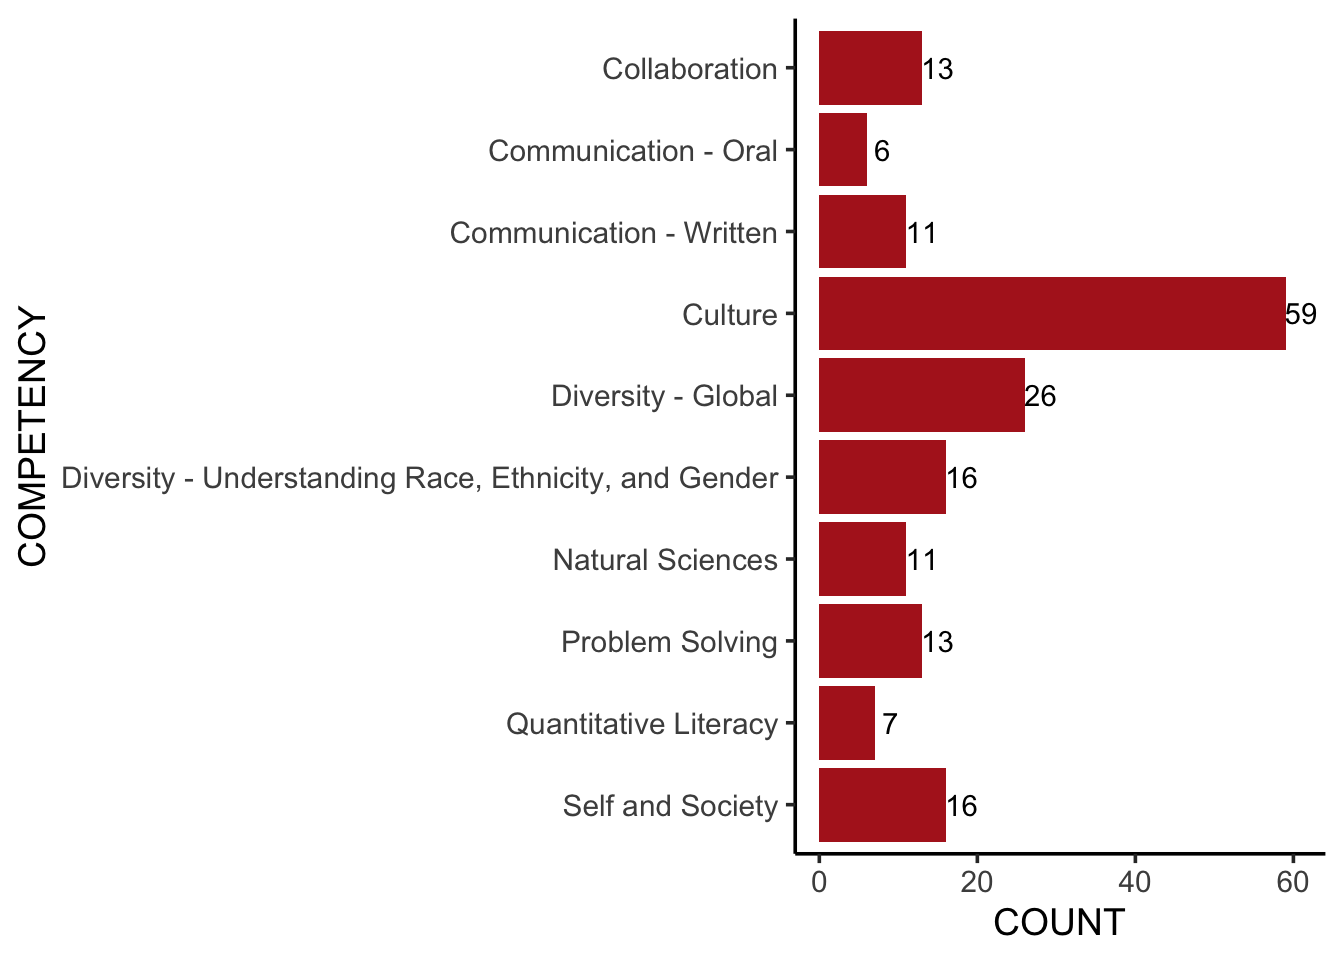
Figure 2: Distribution of course registrations by core competency.
- A total of 92 exams were registered (%).
- A total of 72 student products were registered (%).
- A total of 14 student performances were registered (%).
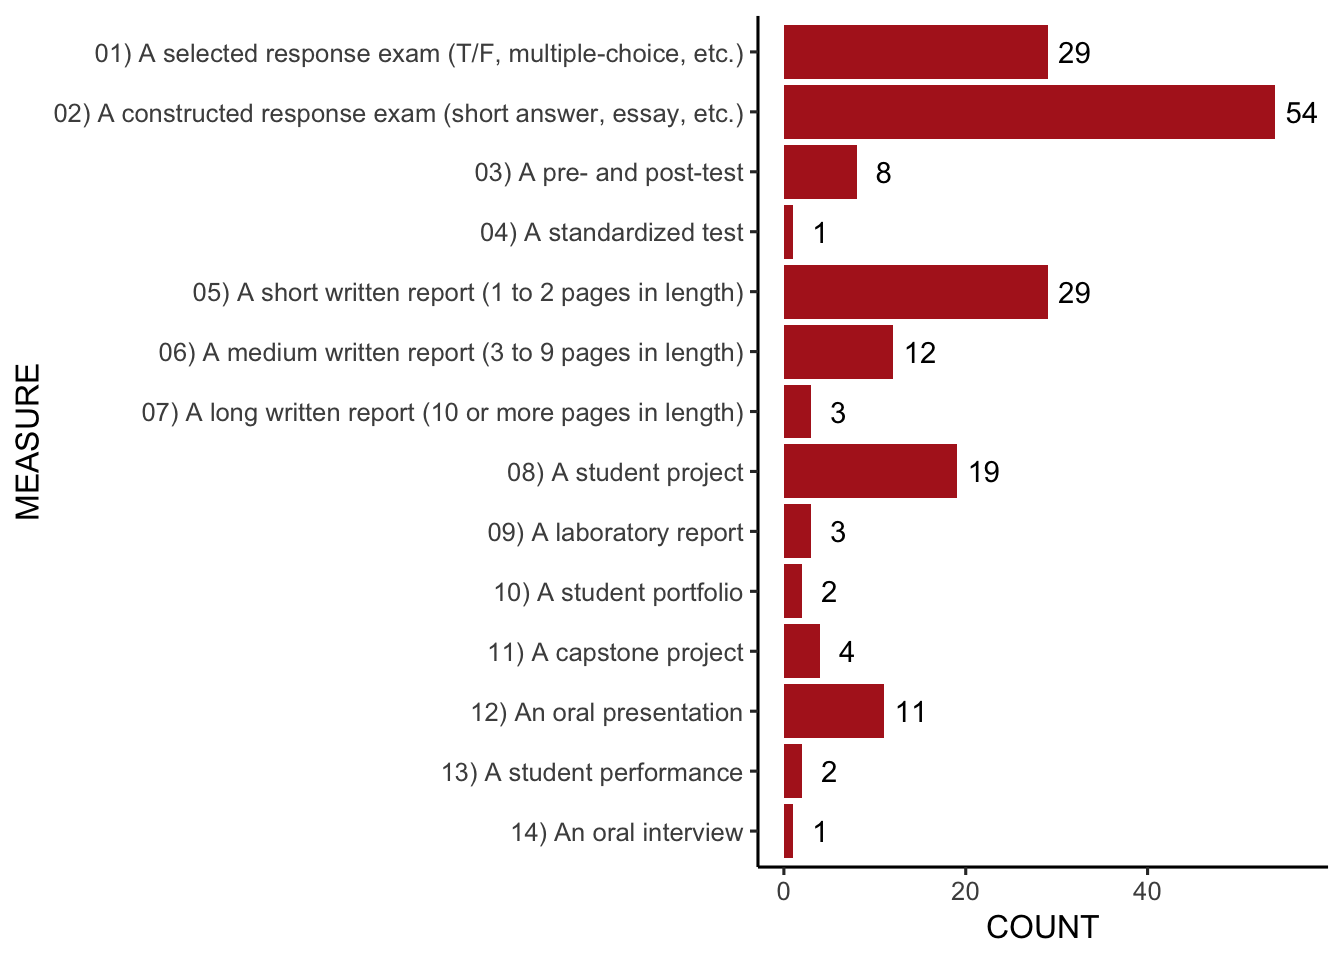
Figure 3: Distribution of course registrations by standardized measure.
Do you think that there are too many exams in this mix? What is the desired balance between exams, products, and performances for General Education?